
FUTURE DEMOGRAPHICS DISCOVERY GROUP MEMBERS
Nelson Baker, Georgia Tech Professional Education
Jessica Curtis, Office of Undergraduate Admissions
Lizanne DeStefano, CEISMC
Mark Guzdial, School of Interactive Computing
Jennifer Herazy, Office of the Provost
Caroline Noyes, Center for Teaching and Learning
James O’Connor, Office of Information Technology
Eric Overby, Scheller College of Business
FUTURE DEMOGRAPHICS
The Future Demographics Group gathered information on past trends (2005-2015) and future projections (2016-2026) in learner demographics at the K-12, undergraduate, graduate, and continuing education levels.
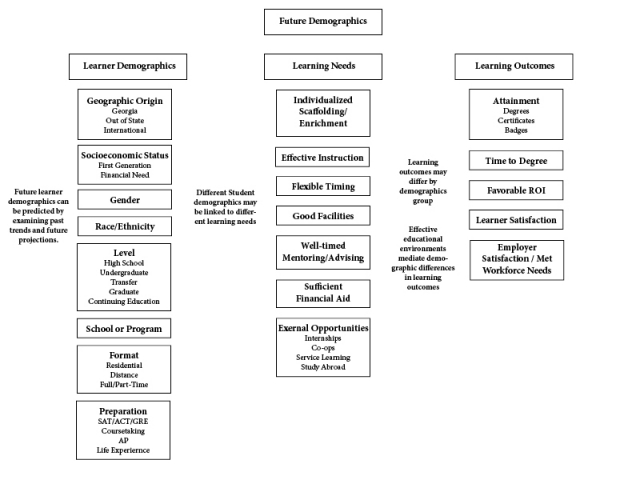
We first attended to global and national trends, then focused on the Southeast, Georgia, and metro-Atlanta and Georgia Tech’s role as an elite public technological research university in that context. Figure 1 represents the conceptual framework that guided our inquiry.
Figure 1: Future Demographics Discovery Group Conceptual Framework
Our data sources included Georgia Tech institutional databases, data from the University System of Georgia, Georgia Department of Education reports, U.S. Department of Education studies, OECD reports, and a variety of other governmental and popular resources.
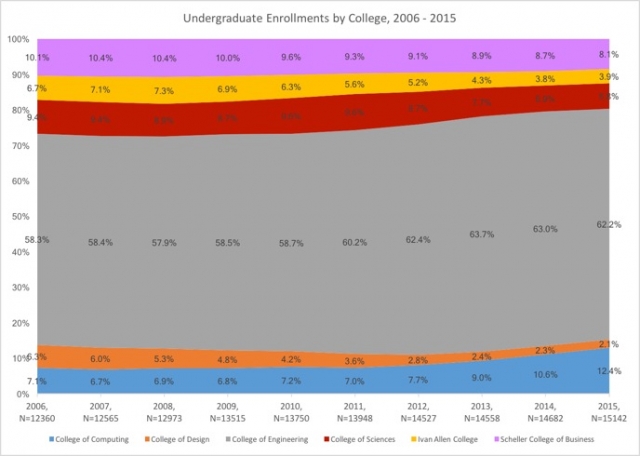
As of 2016, Georgia Tech enrolled 15,487 undergraduate students and 11,350 graduate students. The proportion of undergraduates has grown from 2006 – 2015 (the most recent year for which all data were available) in the College of Computing and the College of Engineering while shrinking slightly in the College of Design, the College of Sciences, the Ivan Allen College of Liberal Arts, and the Scheller College of Business. Figure 2 shows these percentages over time.
Figure 2: Georgia Tech Undergraduate Enrollments by College, 2006-2015
The population of Georgia Tech students, overall, is growing increasingly diverse in terms of U.S. residency, gender, and ethnicity.
Further, as students enter Georgia Tech, we are finding them more and more ahead of the game in terms of Advanced Placement courses. However, they are leaving now with more debt than in years past.
Our work revealed eight key trends that may have relevance for the Commission’s work: increasing learner diversity, aging citizenry, declining educational achievement prior to entering college, changing workforce demands, rising financial burden of education, growing urban populations, and emerging competition. These are summarized below.
INCREASING LEARNER DIVERSITY
The U.S. population is growing at a faster rate than many industrialized nations. Eighty percent of that growth is fueled by immigration, resulting in a more racially and ethnically diverse population.
By 2050, the U.S. population will hit 440 million people. By 2042, it will be majority non-white.
By 2025, 15 percent of U.S. residents will have been born in another country. Currently, U.S. immigrants come primarily from Latin America and Asia. Georgia has the ninth highest immigration rates in the U.S. (2015 SREB Factbook)
NON-U.S. CITIZENS AND RESIDENTS ALIENS
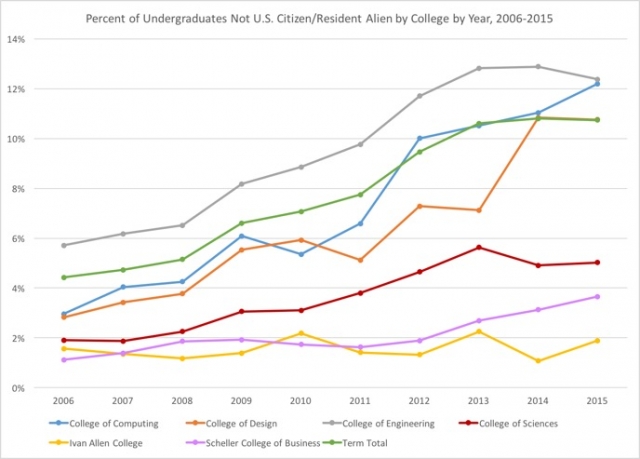
The share of non-U.S. citizens that makes up the Georgia Tech undergraduate population has also been growing.
As shown in Figure 3, every college except Liberal Arts showed an increase from 2006-2015 in the percentage of undergraduates who are non-U.S. citizens or resident aliens.
In 2015, such students made up more than 12 percent of the undergraduate populations in both the College of Engineering and the College of Computing (two of the largest colleges within the Institute).
Figure 3: Georgia Tech Percent of Undergraduates Not U.S. Citizen/Resident Alien by College by Year, 2006-2015
GENDER
Women outnumber men at both the undergraduate and graduate levels in the U.S. and in the University System of Georgia.
At Georgia Tech, the percentage of women in the freshman class increased to 41 percent in 2016. The percentage of female graduate students at Tech has remained steady at around 20 percent. (Complete College Georgia 2015 Status Report)
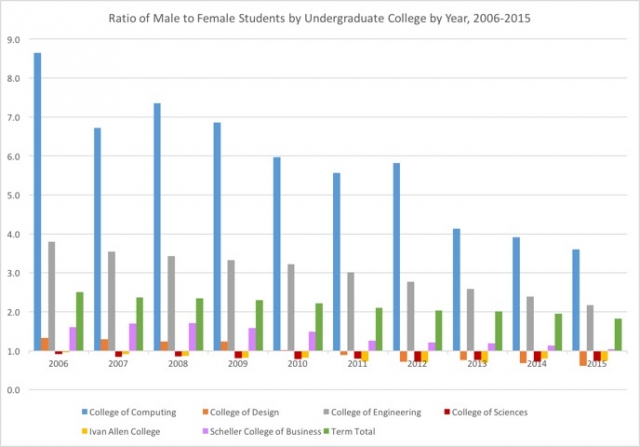
Perhaps more telling is the ratio of male to female students. Figure 4 shows the changing ratio of undergraduate males to females from 2006-2015 disaggregated by college.
The most dramatic shift has taken place in the College of Computing, where the ratio has fallen from a high of nearly 9:1 in 2006 to a low of 3.75:1 in 2015. The College of Design, College of Sciences, and Ivan Allen College of Liberal Arts all show that females outnumber males in their undergraduate populations.
Figure 4: Georgia Tech Ratio of Male to Female Students by Undergraduate College by Year, 2006-2015
RACE/ETHNICITY
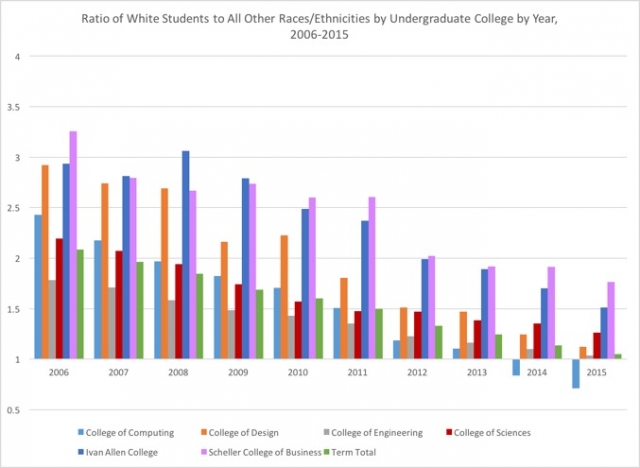
Whereas in previous years, the Georgia Tech undergraduate population was heavily white/Caucasian, this proportion has decreased over the last 10 years.
Figure 5 shows the ratio of white students to students of all other races/ethnicities from 2006-2015. In the Scheller College of Business, this ratio fell from a high of about 3.3:1 in 2006 to a low of 1.7:1 in 2015.
The trend is similar for the Ivan Allen College of Liberal Arts, which reached a high of 3.1:1 in 2008 and has since fallen to about 1.5:1 in 2015.
Figure 5: Georgia Tech Ratio of White Students to All Other Races/Ethnicities by Undergraduate College by Year, 2006-2015
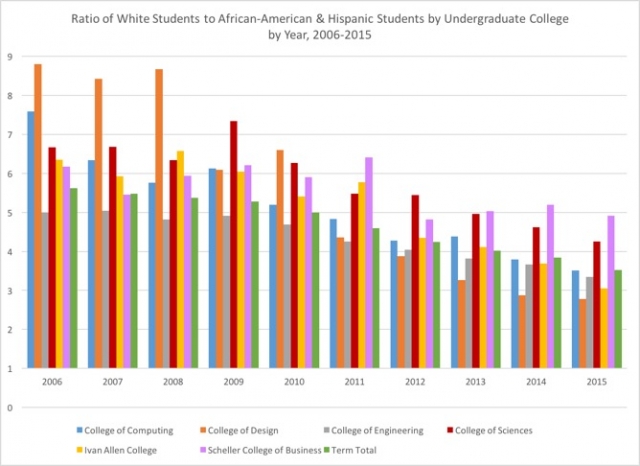
Also of note is the ratio of white students to African-American and Hispanic students, two groups that are historically underserved in the U.S. Figure 6 shows that in the College of Design, this ratio fell from a high of 8.8:1 in 2006 to a low of 2.7:1 in 2015.
While not as dramatic, the ratios for all other colleges also fell during this time period. Figures 5 and 6 both indicate a shift from a more homogenous undergraduate population to one that is more diverse and representative of many different groups.
Figure 6: Georgia Tech Ratio of White Students to African-American & Hispanic Students by Undergraduate College by Year, 2006-2015
MILITARY PERSONNEL AND AGING CITIZENRY
Military Personnel
Military personnel are seeking college degrees at the highest rates in 50 years. They are interested in receiving credit for prior experience and in family and work-friendly policies.Georgia is home to several military installations and has one of the largest veteran populations in the U.S.
Aging Citizenry
While the U.S. mean age is increasing, minority groups are generally much younger than the white population. Georgia is projected to experience a slight increase in the K-12 population over the next decade, largely due to growth in the Latino and Asian populations.
To date, these subgroups are less likely to pursue postsecondary education than white students. Many other states are experiencing a decline in K-12 enrollments.
To maintain enrollments, some universities are reaching out to new state, regional, national, and international markets. Georgia Tech’s current enrollment includes 40 percent out-of-state undergraduate students, up from 32 percent in 2006. Transfer students comprise 15 percent. (State of Georgia Data and U.S. by State Data from Chronicle of Higher Education)
DECLINING U.S. EDUCATIONAL ACHIEVEMENT, BUT BETTER PREPARATION FOR GEORGIA TECH
The educational attainment of U.S. students continues to compare unfavorably to their parents and to international peers. On the international assessment, PISA, U.S. students ranked 25th out of 30 OECD countries in mathematics and 21st in sciences.
Only 8 percent of U.S. students attained the highest proficiency levels compared to the OECD average of 15 percent. Less than one-third of Georgia K-12 students achieve proficiency in math, English, and sciences on the National Assessment of Educational Progress (NAEP). Georgia ranks below the national average in 2015 NAEP performance for all subjects tested.
For the first time in history, U.S. students are less likely to be as educated as their parents. (OECD Education at a Glance)
Meanwhile, a little more than one-third of undergraduates enter the university with some college or AP credit (Figure 7).
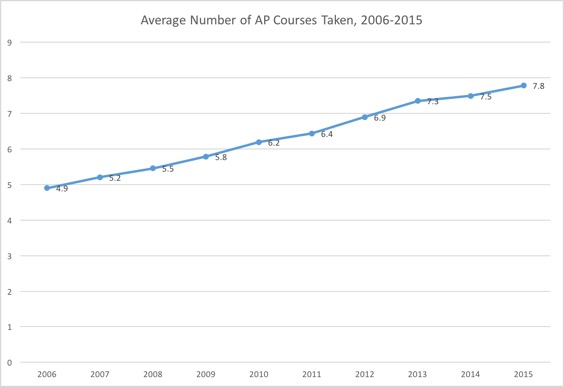
As shown in Figure 8, the average Georgia Tech freshman enters with an average of 7.8 AP/college courses (up from 4.9 in 2006).
Figure 7: Percent of Undergraduates Who Have Taken AP Course, 2006-2015
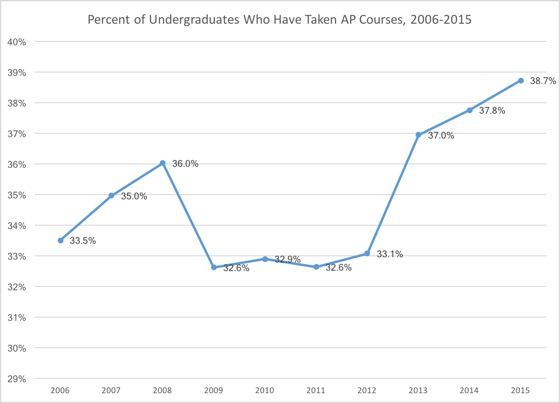
Figure 8: Average Number of AP Courses Taken, 2006-2015
Low-income students from rural and urban high schools are more likely to enter with zero. Multiple programs remain a small part of the Georgia Tech population with about 1 percent to 2 percent of undergraduates declaring multiple majors.
CHANGING WORKFORCE DEMANDS
Due to rising global competition, our nation’s capacity for generating stable, well-paying jobs for a large number of U.S. workers is at risk.
The generation of workers entering the workforce is substantially smaller than those retiring. Employers are seeking efficient ways to upgrade skills of existing employees to fulfill human capital needs. Many adults will need to pursue additional job training or continuing education to remain employable.
There is a high demand for professional and continuing education programs that provide accessible, affordable, flexible, relevant, and convenient opportunities for full-time employees to continue their education. Georgia is not a recognized leader in workforce development efforts, Pennsylvania, Wisconsin, Arizona, and Kentucky are.
The demand for workers in STEM (engineering, information technology, health-related professions, and business) careers is high in international, national, state, and local contexts.
Atlanta ranks seventh nationally in the overall number of bachelor’s and advanced degrees produced, and third in the number of engineering degrees granted. (Metro Atlanta Overview published by Georgia Power Community and Economic Development)
RISING FINANCIAL BURDEN OF EDUCATION
As college tuition continues to rise, college attendance becomes less attainable for lower- and middle-class students.
In 2015, family income surpassed student achievement as the greatest predictor of college attendance. Among students scoring at the top quartile of ACT/SAT, 80 percent of low-income students attended college as compared to 96 percent of high-income students. (Complete College Georgia 2015 Status Report)
Sufficient financial aid supports completion; 67 percent of students receiving assistance completed within six years compared to 58 percent of students who did not receive assistance.
Current federal and state financial aid formulae no longer meet the need of many students, especially part-time, transfer, and returning students.
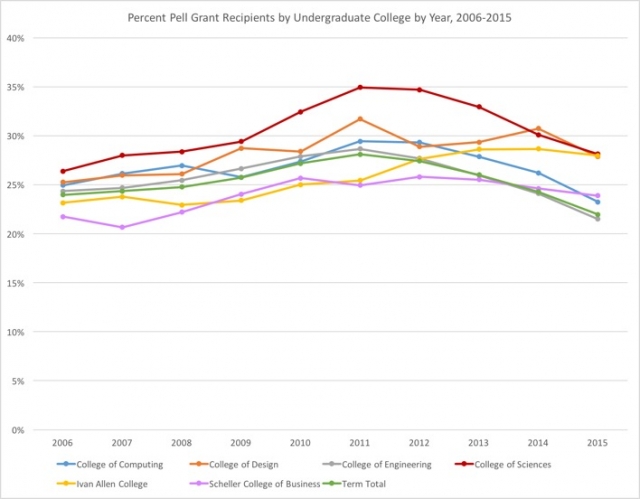
Student debt is increasing. As shown in Figure 9, the percentage of Pell grant recipients at Georgia Tech has declined from 28 percent to 22 percent over the last five years. On the one hand, the growth of Pell grant recipients in the years from 2009 to 2012 is not surprising; the Great Recession took a toll on family incomes, and many more students across the nation required greater educational assistance.
The American Recovery and Reinvestment Act of 2009 provided additional funding for Pell grants, but much of those additional funds has now been expended. Further, employment levels and family incomes have been on the rise, making fewer undergraduates eligible for Pell grants.
As a result, the percent of undergraduate recipients of Pell grants in each college has now largely fallen back to their 2006 levels.
Figure 9: Georgia Tech Percent Pell Grant Recipients by Undergraduate College by Year, 2006-2015
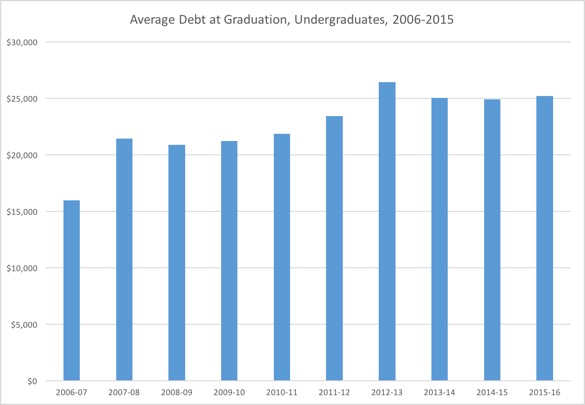
Furthermore, as shown in Figure 10, Georgia Tech undergraduates graduate with $25,000 in student loan debt, and this is consistent with USG averages.
Figure 10: Georgia Tech Average Debt at Graduation, Undergraduates, 2006-2015
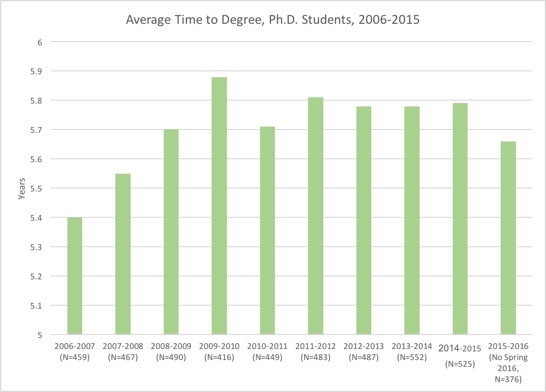
As shown in Figures 11–13, time to degree at Georgia Tech has been declining overall. (Bachelor’s degrees for 2016 have incomplete data and thus show a spike.)
Figure 11: Georgia Tech Average Time to Degree, Bachelors Students, 2006-2015
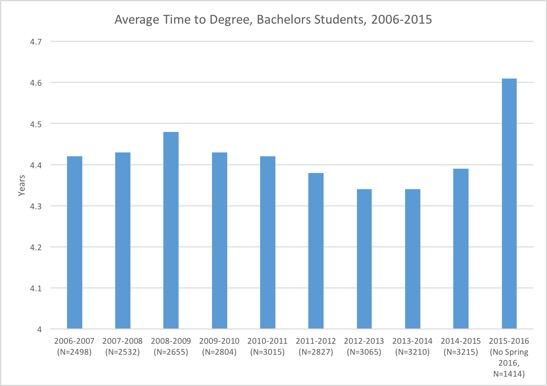
Figure 12: Georgia Tech Average Time to Degree, Masters Students, 2006-2015
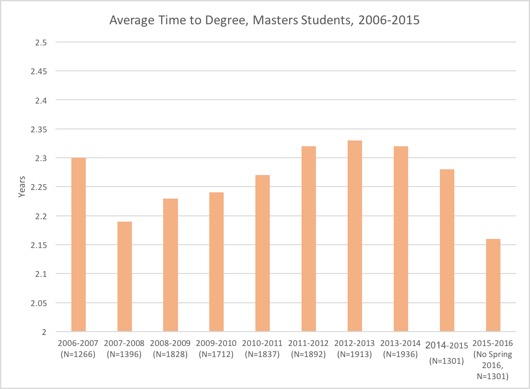
Figure 13: Georgia Tech Average Time to Degree, Ph.D. Students, 2006-2015
This compares favorably with USG and national averages. Georgia Tech receives highly favorable ratings for Return on Investment (ROI) from the U.S. Department of Education.
GROWING URBAN POPULATIONS AND REGIONALIZATION
A growing proportion of the U.S. population will live in cities in the next decade. The Atlanta metro area is projected to experience continued moderate growth during the next 10 years.
Sustainable growth is based upon the interdependence of economic, environmental, and social development. Urban research and technical universities like Georgia Tech can play an important role in studying and promoting sustainable growth in Atlanta. (Metro Atlanta Overview published by Georgia Power Community and Economic Development)
Metropolitan areas such as Atlanta concentrate assets such as human capital, developed infrastructure, and higher education that enable them to attract businesses, create jobs, foster innovation, and promote regional prosperity.
Regional approaches to innovation, geographic clusters of interconnected industries, and supporting organizations are becoming popular. Universities serve as hubs to attract and prepare a skilled workforce, as centers of innovation and knowledge transfer, as thought leaders, and as advocates.
EMERGING COMPETITION
The U.S. continues to be the leading destination for international graduate students in science and engineering. Nationally, 53 percent of international graduate students are enrolled in engineering and sciences; only 16 percent of U.S. graduate students are studying in those fields.
Foreign applications to U.S. institutions have begun to decline in recent years. The number of English-taught programs (engineering, business, natural sciences, mathematics, and informatics) at European and Middle Eastern universities has tripled since 2000. The United Kingdom, Australia, and the Middle East are the biggest competitors for foreign graduate students. (OECD Education at a Glance)
The number of college students worldwide has tripled since 2000. The greatest growth is seen in developing countries in East Asia, Africa, and the Pacific. China, India, and South Korea have made significant investments in higher education in the last decade.
The number of international undergraduates at Georgia Tech has increased from 4 percent to 11 percent in the last decade (Figure 3).
CONCLUDING THOUGHTS AND NEXT STEPS
As the Commission continues to Create the Next in Education at Georgia Tech, it seems critical for all subgroups to actively consider how these demographic trends affect their area of concern and to address ways in which education at Georgia Tech should change in response to changing demographics.
In particular, our group has identified the following scenarios as highly relevant:
- As high school enrollments decline in many states, how will Georgia Tech compete effectively for a smaller pool of eligible students?
- As our country’s population becomes more diverse, how will Georgia Tech respond effectively to a wider array of learner diversity in terms of gender, language and culture, prior experiences, and economic status?
- As greater numbers of undergraduates enter Georgia Tech with AP or college credit, how will Tech’s undergraduate experience adapt?
- As career paths become less linear and more entrepreneurial, how can Georgia Tech prepare its graduates for success?
- How can education at Georgia Tech contribute most effectively to local, state, and national productivity?
- How can Georgia Tech maintain its competiveness for the best students in a changing national and global landscape?
In order to continue to inform the Commission, we recommend that the Future Demographics compilation and reporting continue through the remaining phases of the design process.